Sailing Hydrofoils and the Fold Catastrophe
What floats your boat?
|
Pushing water out of the way
Sitting in a hole
|
A simple bow wave
Climbing a mountain
|
|
|
Archimedes' Principle tells us that a boat floats
because it displaces water. The force required
to push and hold the water out of the way as the
boat is lowered into the water, is
(by Newton's principle of equal and opposite forces)
the same as the force exerted by the water to hold the boat up.
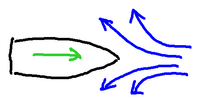
However, as the boat starts to move, it has to push water out of the way. This means
that the water piles up on either side of the bow (the pointy end) and that creates the
bow wave that we can see so clearly as a boat travels.
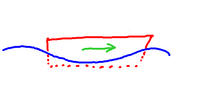
Not surprisingly, the faster you go, the larger the bow wave becomes. The larger bow
wave in turn has a longer wave length (partly because of the boat's speed), and after
a certain point the wavelength equals (or exceeds) the length of the boat. In effect,
the boat has created a hole in which it sits. The deeper sitting boat now has even
more water to push out of the way, and ends up having to climb a mountain of its own
making. |
On the plane |
|
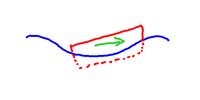
So to make a boat go faster we need to do two things. Firstly, make the boat thin so
that it doesn't have to push much water out of the way. Secondly, make it long so it
doesn't fall in the hole.
For many, many years it was thought that to be fast, boats had to be long and thin.
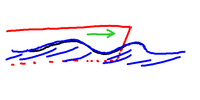
Then the idea of planing arose. When planing a boat is no longer displacing water,
it's skipping over the top. Some of its "lift" comes from the dynamic force of the
water hitting the bottom of the hull, and so less water has to be forced out of the
way. Less pushing, less bow wave, more speed.
To get up "on the plane", though, boats have to go fast, and must be light.
It requires enormous amounts of power to get a large, heavy boat up onto the
plane and keep it there.
|
The need for speed
|
But there's another way to go fast on water. It's been around for a while, but it's
coming into its own.
Make it fly!
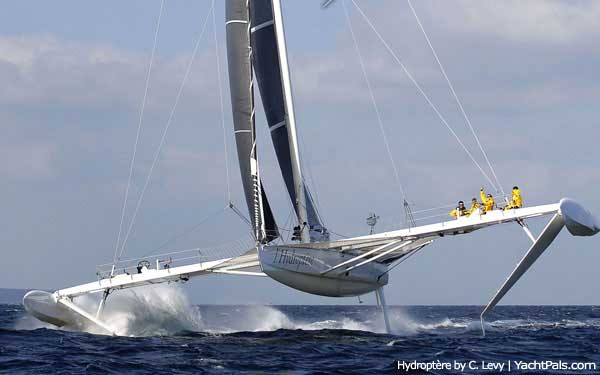
In September 2009 the sailing hydrofoil l'Hydroptčre broke the world speed
sailing record (subject to ratification) with an average speed of 51.36 knots
over 500 meters, and hitting a peak speed of 55.7 knots. But underneath this
amazing scientific and technological feat lies a mathematical catastrophe.
So what are hydrofoils?
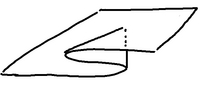
In essence, hydrofoils are wings designed to work in water. As with aeroplane
wings, a combination of deflecting the water and altering the speed - hence
the pressure - provides a lifting force, raising the boat from the water.
The foils themselves create drag, but at speed, there is less drag from the
foils than from the hull.
The exact balance of these differing effects is intriguing. So let's have a
closer look at it.
|
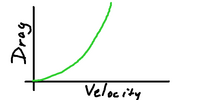
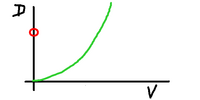
In general, anything moving suffers from drag.
The faster you go, the more drag you experience.
To a first approximation, your drag goes up with
the square of your velocity, as roughly shown here.
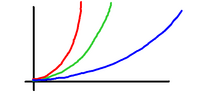
The exact amount of drag depends on your shape
(as well as other factors). More streamlining
usually results in less drag, while being big
and boxy results in more drag.
Your shape does not change the shape of the
drag/velocity curve, but it does change the
steepness of the curve. The red curve might
be for a large truck, and the blue line for
a sports car.
So for any velocity, we've marked one here,
(although I haven't yet - the diagram needs
updating!)
you can see that the red line is higher than
the blue line. A less streamlined shape
suffers more drag.
|
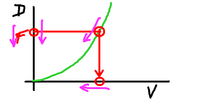
But let's ask the reverse (actually "converse")
question. For a given amount of drag, how fast
are we going?
This is interesting because the drag controls our
maximum speed when we have a given amount of
driving power.
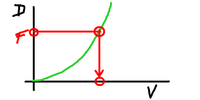
When we travel at a constant speed, the drag
must be exactly balanced by the driving force.
So if we say how much power we can supply,
that will be the amount of drag.
Start from that level on the diagram, move
across to the curve, then down to the X axis
and we can see how fast we can travel, given
that amount of power.
|
|
|
|
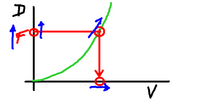
If we supply a little more power then we will
accelerate. The force supplied goes up, and
the velocity goes up taking with it the amount
of drag we experience. When that matches the
new amount of driving force, we are again balanced.
The same thing happens if we reduce our driving
force. We no longer have enough power to overcome
the drag, we slow a little, the drag reduces and
again we are in balance.
|
|
|
|
In short, by varying slightly the power provided
we adjust our speed. At low speeds, small changes
in the power can give larger changes in the speed,
while at high speeds, small changes in the power
only result in very small changes in the speed.
And we can see this by looking at the slope of
the curve. The gradient is much larger at higher
speeds than at lower speeds. The equations for
the velocity/drag curve allow precise analyses,
but we won't go into that much detail here.
|
This needs a
better diagram.
|
Now we complicate things
|
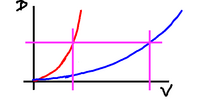
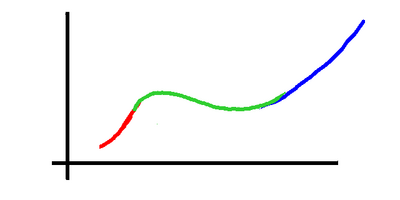
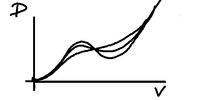
Now let's look at a sailing hydrofoil. This has
two different curves at the same time
(sort of).
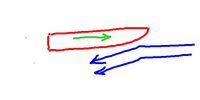
When travelling with the hull in the water the
drag is very large, because there's not just the
hull, but there are also the hydrofoils to push
through the water. For that mode, we have the
red line. A little velocity and the drag shoots
up.
But when flying, the drag is very small. In
that case we use the blue velocity/drag curve.
Much to be preferred. Even though we're
travelling fast there isn't much drag.
The truck is now a sports car.
|
|
|
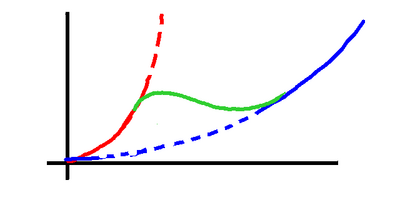
So here's what happens. To start with it's tough to
get going, but as we pick up speed the foils start
to lift the hull.
The increase in drag from the foils continues, of
course, but the drag from the hull falls away even
faster, and so the total drag peaks, then decreases
while the hull is being lifted out, and then starts
to rise again.
We move from "truck" mode to "sports" mode, so
we move from the red line to the blue line.
The green line shows the transition. Typically
"lift-off" can happen at 4 to 6 knots of speed,
which is achievable in around 10 knots of wind.
Once flying the craft can typically travel at
1.5 to 2 times the speed of the wind.
|
 |
|
You may be wondering how a sailing vessel
can go faster than the wind. It's all to
do with angles and trigonometry, and although
it's not hard, this article is already
complicated enough. |
|
|
|
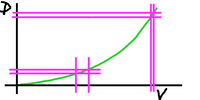
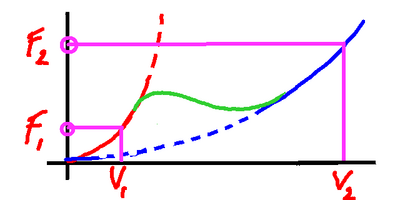
So when we've not got much power and we're
travelling slowly, we're travelling really
slowly. But when we have more power and get
over the transition, we are travelling much,
much faster.
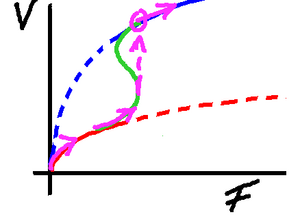
We can see here with driving force F1
we travel at speed V1, but with force
F2 we can travel at speed V2
|
|
|
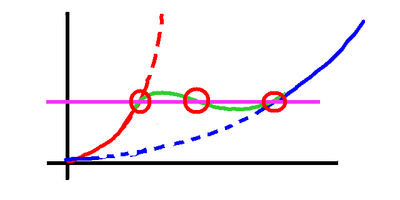
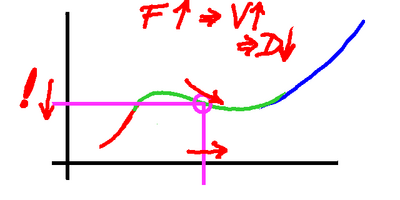
But what about in between?
Here we have a driving force in between. We've
put the line across at the amount of drag that
balances our driving force, and we ask "How fast
are we travelling?"
The problem is that there appear to be three
answers!
|
|
The exciting bit!
|
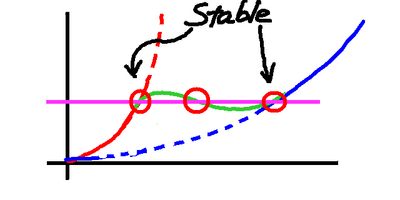
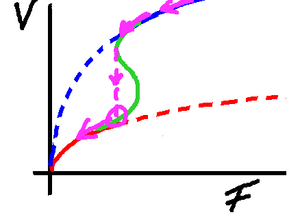
Not all answers are equal. We can see that
the slowest and the fastest really just look
like the earlier cases of the truck and the
sports car. Nothing interesting there. Add
a little power, increase a little in speed,
and everything is back in balance.
|
|
|
But what's happening in the middle case?
So far we've been
equating Force supplied with drag, because
a little more force gives a little more
speed which gives a little more drag to
balance the power, and all remains stable.
Here, it's radically different.
|
|
|
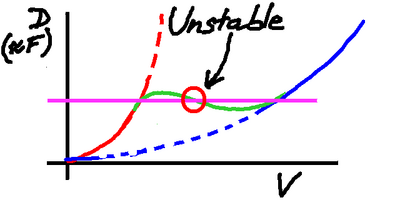
In the middle section, shown here in green,
the velocity/drag curve slopes downwards,
and that makes all the difference.
Now if we provide a little more power we
speed up, having more power than drag.
But as we go faster we get less drag,
so the imbalance increases, and we go faster
and faster, until finally we're going fast
enough that the drag is increasing again,
and at last catches up.
So in this section we no longer have the expected
relationship between drag and force. Instead we
find that an increase in force causes an increase
in speed which causes a decrease
in drag, which creates even more acceleration.
|
|
|
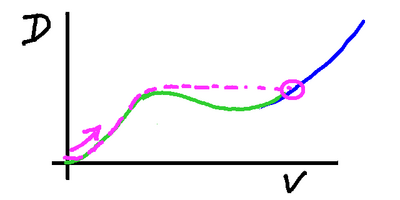
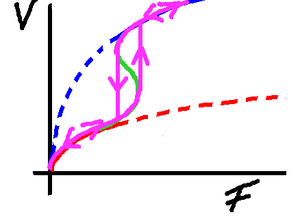
So starting from a gentle roll we slowly
build speed, increasing gently until we
get towards the turning point of the curve.
Suddenly we get positive feedback and our
speed snaps up with enormous acceleration,
until finally we balance out again on the
blue part of the curve.
Plotting drag versus velocity is no longer
giving us the information we want. Really,
we want to start with the driving force
available, and work out how fast we'll be
able to travel.
We need to turn our graph around.
|
|
Speed as a result of power
|
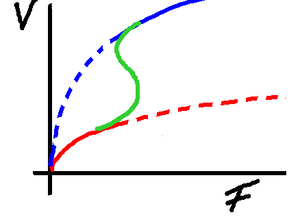
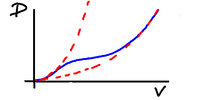
So here we have drawn the same graph, but now
we have velocity as the result, running up the
Y-axis, and we have Force along the X axis.
Previously we were looking at drag, but once
the system is in equilibrium force and drag
are balanced. It makes sense, therefore, to
consider the velocity we get as a result of a
given driving force.
|
|
|
Here we can see that as we slowly increase the
driving force so we climb the red curve. But as
the hull starts to rise from the water and our
drag decreases we have a sudden leap in speed.
We find ourselves flying, having gone through
a discontinuity in the Force/Velocity curve.
Typically take-off will happen in 10 knots of
wind, and the craft will accelerate from 5 kts
to 15 or 20 kts in the space of a couple of
boat lengths. Dramatic indeed!
|
|
|
Slowing back down it's the same, only in reverse,
and note that the discontinuity happens at a different
place. Now we stay on the upper curve - we
remain flying - until the hull touches the water
and we slow with a very rapid deceleration, often
accompanied by a massive splash!
|
|
|
So here is the profile of a complete cycle. It starts
from rest, applies increasing driving force until the
vessel achieves "take-off" whereupon it accelerates
rapidly to a cruising speed. As the driving force is
then slowly reduced the speed decreases smoothly until
the hull touches the water and the vessel slows rapidly.
Of course, the discontinuities aren't jump discontinuities,
the vessel has a mass, so the curve is, in reality, more
smooth than this graph might lead you to believe. However,
the sudden acceleration and deceleration are very real.
|
|
Different craft, different curves
|
It's possible that a particular craft doesn't
exhibit the dramatic change, transitioning
more gently from one mode to another.
Much less fun.
We can overlay the drag/velocity curves for craft
with different characteristics on a single graph.
|
|
|
|
However, it can be easier to visualise if we
separate the curves in the third dimension to
create a surface.
Here we have a surface, with the most
dramatic version in the front, and the less
dramatic version at the back, with a smooth
transition between them. A vertical slice
parallel to the screen gives a single Power/Speed
graph, and therefore corresponds to a single
vessel's characteristics.
The graph shows that in many places, that is,
combinations of design and windspeed/power, there
is a single resulting stable speed. But it also
shows that there are areas where there is more
than one possible speed, depending on whether the
craft is on foils or in displacement mode.
The graph also shows that by moving around in
a continuous manner, the system behaviour can
nevertheless be discontinuous. A sudden leap
or loss of speed can occur when we move from an
area with more than one stable speed to an
area with only one.
|
We use mathematics to understand systems where
stable points of equilibrium
can appear and disappear as input parameters
change. Such systems can show discontinuities
in their output, even though the inputs have been
changed smoothly, and by small amounts. By
studying such systems, we can hope to classify
the circumstances under which they occur, and
possibly anticipate, or even prevent, undesirable
"catastrophic" changes. Hence the name of this
field of study: "Catastrophe Theory."
Enthusiasts point to discontinuous behaviour that
can turn up in stock markets, crowd behaviour,
markets, and other places, and wonder whether the
study of Catastrophe Theory may one day find
direct application in such fields. What we've
shown here is that simple examples really do turn
up in real life.